13 Top Software Development KPIs to Measure Performance
If you want to develop software and want to make it successful, then you need to measure the performance of your software. Even a report by ACM (Association for Computer Machinery) has stated that it can be done considering KPIs for software development.
But which software development KPIs to track for your project?
In this blog, you will learn about the top 13 KPIs to consider for your software project.
Let’s get started.
Table of Contents
What is a Software Development KPI?
Key performance indicators (KPIs) for software development refers to parameters that help you measure the performance of your custom software.
In addition, the KPIs help you discover how well your software development efforts are aligned with the business objectives.
So, throughout the software development life cycle, the development team measures the performance and quality of software products by following the right KPIs.
To properly implement KPIs at different stages, you need to be clear with the entire software development life cycle. However, if you are unaware of the development cycle or want to understand it thoroughly, read our detailed post on the software development life cycle (SDLC).
Want to Develop a Custom Software?
Our technical consultants will discuss your business challenges, validate your idea, and devise a roadmap strategy for software development.

Now, it is essential that you know the significant key performance indicators that you can implement for the successful delivery of the software.
13 Top KPIs of Software Development
In this section, you will learn the most important software development metrics that you can consider for your project. As there are different types of software development, every type of software development should measure its metrics differently. We have explained each key performance indicator in detail.
7 Software Development KPIs to Measure Software Developer Productivity
| KPIs That You Must Track for Software Developer Productivity | ||
|---|---|---|
| Serial No | KPI | Basic Description |
| 1 | Cycle Time | This metric allows to measure the time required to complete a certain task or process. |
| 2 | MTTD and MTTR | This metric allows to measure the estimated time that the developer takes to find a bug and repair it. |
| 3 | Development Velocity | This metric measures the time it takes to complete a certain task. |
| 4 | Cumulative Flow | The metric shows the visual form of project progress. |
| 5 | Spirit Burndown | This metric shows you the visual form of tasks completed and remaining in a project. |
| 6 | Release Burndown | This metric allows you to measure your progress against release work. |
| 7 | Flow Efficiency | Allows you to measure the active time and total time spent on a project. |
Cycle Time: Time Required to Complete the Task or Process from Start to Finish
What is cycle time KPI?
This cycle time KPI for software development measures the time being spent from work started to work delivered. Modern software development teams use cycle time charts to gauge the software development process’s efficiency.
Why measure cycle time during software development?
Measuring this cycle time for your project will help you quantify your team’s performance. In short, it gives you an estimation of how sooner your software development team will be able to complete the assigned tasks.
MTTD and MTTR: Estimate Time of Developers Team to Find a Bug and Repair it
What are MTTD and MTTR KPI?
MTTD refers mean time to detect. This metric allows you to know for how long the problem exists in a software program before any of the team members get aware of it. This metric is considered under IT incident management. For finding MTTD, you need to sum all incident detection times divide by the total number of incidents. Here is the formula of MTTD KPI:
MTTD = Sum of incident detection times / total number of incidentsDevelopment Velocity: Time Estimate to Complete a Certain Task
What is development velocity KPI?
Development velocity is the pre-defined set time in which your development team completes a specific task during a sprint. In scrum or agile methodology, this length of time is also known as scrum velocity or agile velocity.
So to measure development velocity, you can use the method called story points that calculate how much effort has been put into a software solution. By estimating story points, you can easily evaluate the project size and the time developers will take to complete the project.
With velocity, it becomes easy to set realistic expectations from the developer and projects in terms of timelines and objectives.
Cumulative Flow: Visualization of Workflow and Project Progress
What is cumulative flow KPI?
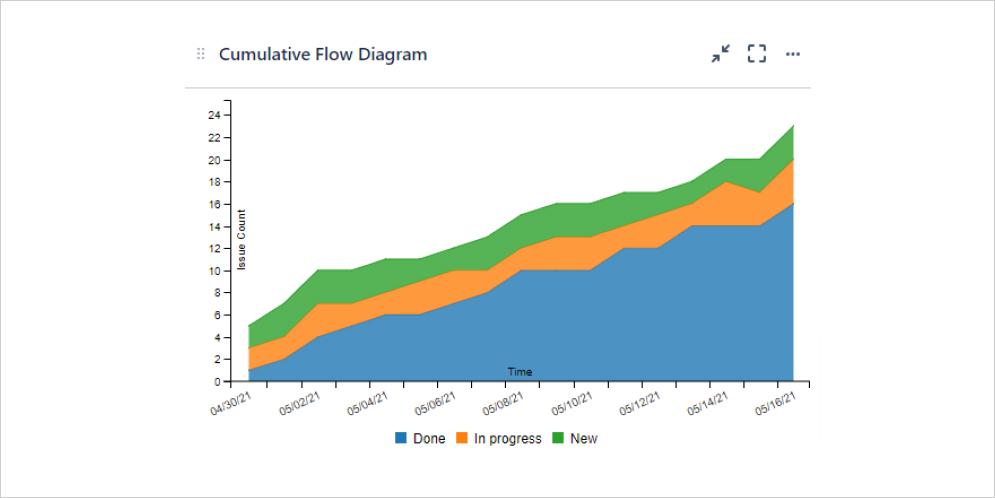
Cumulative flow is a visual diagram that demonstrates the status of all tasks which are in progress. Different colours are used to show different stages of the software development life cycle, such as ‘Done’, ‘In Progress, or ‘New’.
The aim of creating this diagram is to offer a visual representation to see how tasks are distributed across all the stages. The following graph shows the relationship between the time taken to complete the following task by highlighting various stages.
Source: Atlassian.com
Why measure cumulative flow during software development?
This graph will help you track the performance of the software development team and keep them on their toes to complete the work in a specific timeline. This actually fosters a culture of completing a task within the deadline.
Sprint Burndown: A Visual Representation of Work Completed and Remaining
What is sprint burndown KPI?
This particular KPI determines how much work is actually completed by the software teams during a sprint. Please note that velocity is something different from sprint burndown. In velocity, you actually measure how much work can be done in a sprint.
Why measure sprint burndown during software development?
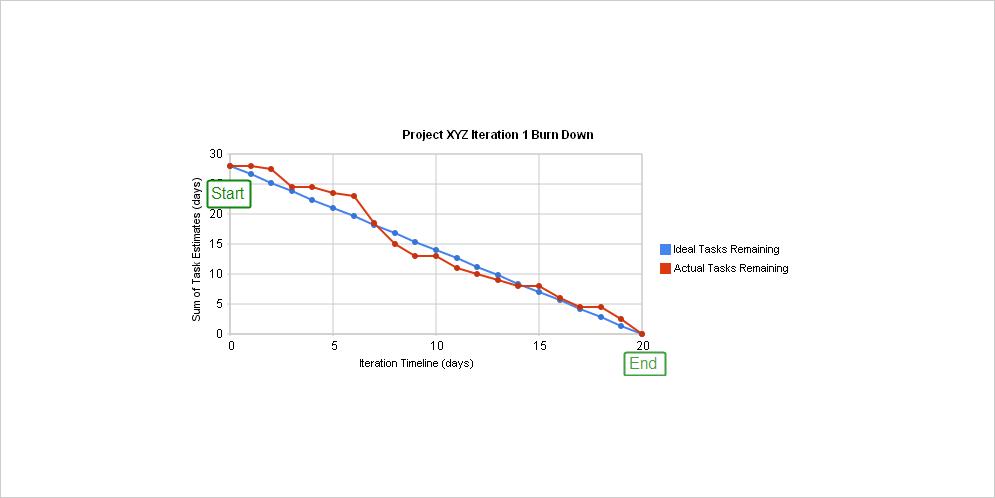
This sprint burndown software metrics help you check on the software team’s productivity in real time. It will give you a check on completed as well as pending tasks so that you can plan other things accordingly. Check the following line chart graph, which represents how many tasks are still remaining to be completed.
Source: Wikipedia
This software development metric helps you keep track of software team performance when they are unable to match expectations. With such a visual representation, you can also see how the tasks are distributed across the stages.
Release Burndown: Checking Progress of Team Against the Work of a Release
What is release burndown KPI?
The release burndown metric is considered to check the status of the project. In short, you get to know the progress of the project as it relates to its release date. This will help software developers to inform about the delays in the launch or early versions of the project.
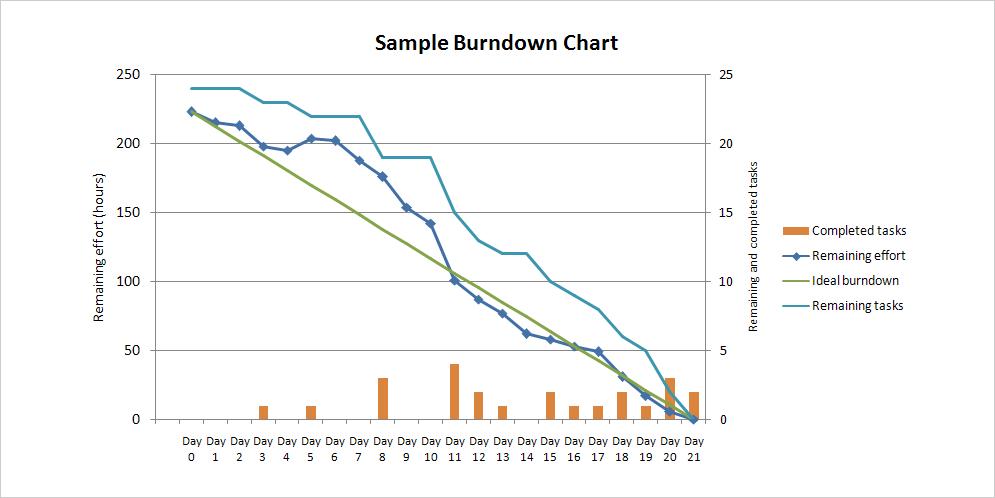
The following chart shows whether the developers are ahead of schedule, behind schedule, or exactly on schedule.
Source: Wikipedia
Why measure release burndown during software development?
In short, with this representation of sprints and story points, you can determine if your project will meet the deadline or not. In addition, a good release burndown chart will help you determine the number of sprints you need to complete your project.
Flow Efficiency: Calculating the Actual and Total Time Spent on Project
What is flow efficiency KPI?
Flow efficiency is determined by calculating ratios between your active time spent on the project and the total time taken to complete it. This has been observed that developers need extra time to move from one task to another. And sometimes, developers are dependent on other development team members, which leads to increasing flow efficiency in the project.
So in case you want to calculate flow efficiency, then divide your total active time spent on the project by total cycle time.
Why measure flow efficiency during software development?
Discovering flow efficiency will help you understand better what caused a delay in the project and whether it was necessary or not.
Now, let’s understand the MTTR. MTTR is a metric that allows you to measure the average time required to troubleshoot and resolve the bug from the software. This helps to know how quickly your development team responds to sudden software breakdowns and repairs them for smooth functioning again.
6 KPIs for Tracking the Software Development
| KPIs That You Must Track for Software Development | ||
|---|---|---|
| Serial No | KPI | Basic Description |
| 1 | Code Churn | Allows you to measure the code changes made in a certain file. |
| 2 | Code Stability | This metric allows you to measure code that is not changed often during development. |
| 3 | Code Coverage | This KPI allows you to measure the code that is automated and tested. |
| 4 | Code Simplicity | Allows you to measure the code that is easy to understand in the entire project. |
| 5 | Net Promoter Score | This KPI allows you to measure the success of your project. |
| 6 | Defect Density | This KPI allows you to track the code defects of a certain unit against total code units. |
Code Churn: Measuring the Changes Done in Code of a Particular File
What is code churn KPI?
Code churn refers to measuring the time in which the amount of code has been changed. That means if a code has been rewritten to integrate a new feature, then this would require high maintenance.
Why measure code churn during software development?
Code churn is useful to evaluate the stability of your code so that you can easily evaluate the development stages, which are more unstable and need extra focus and which are the most stable part of the software development process.
Check the below image for your reference. With such graphs, you can look for regularities in code changes to identify issues in the software development process and the reason behind the spikes in code changes. This approach helps you avoid writing unstable code.
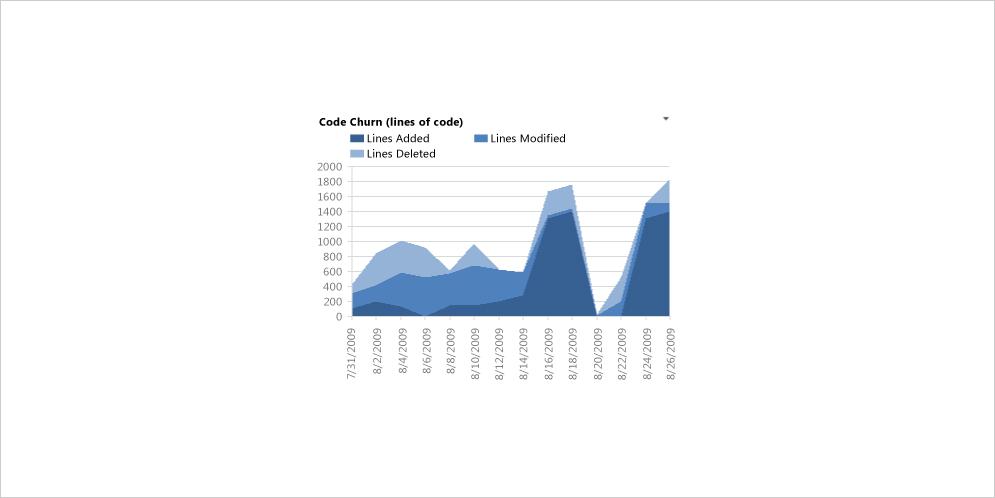
Source: Microsoft
As stability is really essential before you release your product into the market, you need to set this KPI to ensure stability. There might be some time when you would need to rewrite the code according to the going trend in the market, which might cause instability.
Code Stability: Measuring Code That is Not Changed Often
What is code stability KPI?
Measuring code stability is not easy. However, you need to keep track of it to see how many times the code changes within the software. Code stability means that there might be little changes to the software, which could potentially harm your business.
Ideally, changes in a few lines of code should not change the performance of the application. To measure code stability, developers often need to chart the frequency of code changes so that they can keep track of it. Stability can be taught in terms of percentage when the deployed code results in downtime.
Code Coverage: The Amount of Code Covered by Automated Tests
What is code coverage KPI?
Code coverage is a KPI for software development that measures the quality of the code by running automated tests. This is one of the significant software metrics which ensures continuous delivery and test-driven development (TDD).
Why measure code coverage during software development?
A measurement of code lines that are executed well when a test is run to determine how many of your code lines run perfectly. However, do not estimate the number of lines that are covered. Performing a test and achieving 100% code coverage does not generally mean that the code has been tested thoroughly.
Instead, it only suggests that you have prioritized the codebase and features that are essential for you in your software development project.
Code Simplicity: Measuring If the Written Code is Easy to Understand
What is code simplicity KPI?
Code simplicity is a KPI engineering metric to measure code complexity using various methods. One method is calculating the number of paths it has taken for you to write the code to get the work done. If you have taken fewer paths, then it is a good sign.
Why measure code simplicity during software development?
The code simplicity metric will help you measure the risks posed by various issues during the software development and testing process. Also, you can easily find all the parts which have a maximum number of bugs. So, if you have written simple codes, then it is easy to test and maintain, and it also helps new developers who are on-boarded in the middle of the project.
Net Promoter Score: Measuring Customer Experience on Your Software
What is the net promoter score KPI?
Every software is built for users; sometimes, it can be for normal users and sometimes for corporate users. However, no matter what type of users are using the software, being an owner of the software, you need to find out what they think about the performance of the software.
Why measure net promoter score during software development?
The net promoter score is helpful in measuring customer satisfaction and loyalty. This will help you predict how likely your customers will recommend your high-quality software product to others. The NPS value ranges from -100 to +100.
Also, this helps in identifying the challenges faced by users if they do not recommend it to others. Moreover, you build long-term relationships with your end-users and find a customer satisfaction score and customer effort score to discover how likely they are able to complete a transaction.
Defect Density: Measuring the Number of Defective Code Units Produces Against the Total Units
What is defect density KPI?
Defect density is a metric that allows your development team to track the defective or confirmed bugs in software or module during the development of the product. The defect density in the software is counted per thousand lines of code. Let’s take an example of how you can calculate the defect density in your code using the following formula.
Defect Density = Total Bugs / Total Number of Code LinesSo, if your team produces 50 bugs per thousand lines of code, then your defect density of code will be 0.05.
These are the key performance indicators that decide the success of your software. In fact, we also keep track of the progress of our projects to ensure we are able to deliver high-end software solutions within the estimated timeline and budget.
We are a well-known software development company in Canada to build more than 300 software solutions for clients worldwide. Some of our top solutions are Undrgrnd Futbol, Super Shot 24, and HOWTO. Check our portfolio section to learn more about our developed solutions.
Now you must be having doubts about how key performance indicators can actually help your business thrive. If so, then check the next section to find the benefits of implementing software metrics to determine software performance.
Importance of KPIs in the Software Development Process
The lack of a systematic approach to planning your software development will lead the project to impulsive failures.
This is where KPIs play an important role in the software development life cycle (SDLC) to help you reach your defined targets and ensure high-quality software. Even when a problem arises, tracking the issue and fixing it as soon as possible is easy.
Along with this, setting key performance indicators before beginning the software development process help you get several benefits.
Here are some of the benefits of finalizing KPIs for software development.
- Setting KPIs will help you increase your return on investment (ROI) as it enhances the overall team/developer performance.
- With KPIs, you will be able to cut down on software development costs as you identify issues early on that you will not require an extra round to fix bugs or additional management.
- KPIs let the software development teams, along with the software developers and project managers, identify, track, and communicate any issues that are found in the process to improve the performance of the software.
- In fact, the stakeholders are able to keep up with the progress of software development projects. It is easy for them to handle or manage the software project better and check the workflow to forecast the development.
Now let’s find out more about the best practices that you need to implement to track the KPIs.
Which are the Best Practices for Tracking KPIs?
Even though you know the most number of KPIs, it is essential that you implement them strategically in your software development process. Let’s discuss the best practices:
- The right software metrics should also involve regular meetings and discussions with the team members. You will be able to find new opportunities to enhance the quality of your project.
- KPI engineering metrics matter; however, you should not implement many metrics at the same time. Instead, select only a few metrics that help you with in-detailed reports and decision-driven insights.
- Also, implementing the right metric helps you make the best strategy for your project. Suppose you see a positive trend after implementing a certain metric measure, but your goals are still the same. In that case, you need to review your strategy and probably make changes to it.
- It is better to break a project into multiple measurement periods instead of constantly interrupting the work. This will help you determine the exact progress and give you a better understanding of the problems which are causing a delay in the project.
- In case, you find that any particular KPI is not offering valuable insights for reaching the team goals, immediately stop using it. This means your selected metric is unable to measure the progress and is not aligned with your goals.
If you are looking for best practices to follow during software development then you can read our blog on best practices for software development.
Looking to Hire Software Developers for Your Project?
Talk to us. We are one of the best software development companies in Canada and the USA to consult more than 100 clients. Our software developers will help you.
If you are still looking for more answers on software project metrics and other aspects of KPIs, check the next section. In the following FAQ section, we have answered some of the most asked questions based on KPIs for software development.
FAQ About Software Development KPI
What are the major KPIs that need to consider after software deployment?
Here are a few key performance indicators that decide how well your software is performing.
- Customer satisfaction
- Profit margin
- Client retention rate
- Revenue growth
- Revenue per client
How to track the performance of the software?
To track the performance of your software product, you can consider these universal parameters.
- Requests per second
- Response time
- User transactions
- Virtual users per unit of time
- Error rate
- Wait time
- Load time
What are the different types of key performance metrics?
The software development metrics are divided into 3 types as follows:
- Financial metrics
- Customer metrics
- Software metrics
Why is it essential to measure KPIs?
Here are the following reasons why you need to measure KPIs:
- To monitor the company’s health
- To measure the progress of the project and to maximize team performance
- To analyze the pattern over a specific time
- To solve problems and identify opportunities
- To find a new plan and adjust according to the overall development process
Let’s Develop a Successful Software
With modern agile methodology, you analyze qualitative factors using quantitative metrics and operational metrics to enhance the overall software development process. These metrics help you find new opportunities in the process, fix issues immediately, and optimize the strategies.
In this blog, we have discussed the top 13 software KPIs that you can include in your software project and guarantee success. Contact our development team if you want help implementing one of the software metrics. We will help you strategize your software development process with the software metric.
Editor's Choice

Telemedicine Software Development: A Complete Guide to Building Remote Healthcare Platforms
Medical Billing Software Development: The Complete Guide for Healthcare Providers

A Complete Guide to Pharmacy Management Software Development
All our projects are secured by NDA
100% Secure. Zero Spam
*All your data will remain strictly confidential.
Trusted by


Bashar Anabtawi
Canada
“I was mostly happy with the high level of experience and professionalism of the various teams that worked on my project. Not only they clearly understood my exact technical requirements but even suggested better ways in doing them. The Communication tools that were used were excellent and easy. And finally and most importantly, the interaction, follow up and support from the top management was great. Space-O not delivered a high quality product but exceeded my expectations! I would definitely hire them again for future jobs!”

Canada Office
2 County Court Blvd., Suite 400,
Brampton, Ontario L6W 3W8
Phone: +1 (437) 488-7337
Email: sales@spaceo.ca

